Overcoming Data Chaos: How Machine Learning Compensates for Inaccurate Utility Records
Aleksandr Ivanaiskii, PhD
Industrial AI Founder & Systems Architect
Evgeny Ivanaiskii, PhD
Domain Expert
Sergei Shipilov
AI Architecture Lead, Rivixi LLC
Abstract
The implementation of predictive analytics in public utilities often faces hidden resistance from field engineering teams. Maintenance departments are reluctant to share operational data, fearing that the inevitable inaccuracies, gaps, and "historical chaos" in their GIS and maintenance logs will reflect poorly on their competence. This case study demonstrates how modern Artificial Intelligence (AI) handles this chaos. By leveraging advanced data engineering techniques—such as Spatial Aggregation, Missing Value Encoding, and Target Encoding—the Rivixi Decision Fusion pipeline not only successfully processes unstructured data, but extracts valuable predictive signals from it. This robust foundation allowed our downstream ensemble model to achieve a Recall rate of 93.88% on balanced evaluation subsets when detecting pre-failure zones.
1. Introduction & The Challenge
In academia, machine learning algorithms are typically tested on pristine, sterilized datasets. However, when data scientists encounter the real-world utility sector, they face a harsh reality: asset registries are only half-filled, dates of major overhauls are lost in paper archives, and 311 dispatchers log pipeline bursts based on arbitrary building addresses (e.g., "120 Main Street") rather than the precise underground pipe segment.
A common reaction from utility management is: "We are not ready for AI yet; let's get our documentation in order first." This is a classic trap. Perfect order is unattainable. Legacy databases are filled with misspellings, topological distortions, and varying scale resolutions (from 1-foot tie-ins to 500-foot transmission mains).
Novelty and Contribution
Our approach does not require utilities to rewrite decades of archives to meet strict AWWA/ASME data standards. Instead of forcing human data to fit standard algorithms, we adapt the algorithms to the reality of the data. By applying specialized pre-processing techniques designed for extreme class imbalance and unstructured records, we treat "missing data" and "typos" not as errors, but as independent variables that carry profound predictive weight.
2. Architecture & Methodology
Our data preprocessing pipeline transforms chaotic utility logs into a structured matrix suitable for the two-level Decision Fusion architecture (CatBoost for static parameters, LSTM for time-series dynamic events).
Fig. 1. Data Cleaning Pipeline Flowchart
Topological Distortion Correction (Spatial Aggregation): Dispatchers often "attach" underground failures to the nearest surface address, causing severe geospatial misalignment. To resolve this, we group neighboring pipe segments into larger, aggregated Sections (250–500 feet) and territorial Tags. If a dispatcher's entry misses the exact pipe by 150 feet, the error is absorbed at the Section level, capturing the overall zone degradation.
Case Study in Practice: In our pilot city network covering 1,200 miles, over 68% of dispatcher logs originally pointed to generic street addresses rather than specific underground assets. By implementing spatial aggregation, we reduced "orphaned" records from 68% to 7%, capturing the overall zone degradation instead of chasing 1-foot accuracy.
Fig. 2. Incident Localization Accuracy Before and After Aggregation
Asset Scale Discrepancy Normalization: Raw GIS data contains both giant pipes and dwarf pipes. Left untreated, algorithms create a false correlation where "longer pipes break more." We stitch short segments together to form standardized analytical sections of comparable physical mass.
Case Study in Practice: Our raw dataset contained 14,000 pipes. Over 6,000 were "dwarfs" under 5 feet, and 800 were massive transmission lines over 500 feet. By standardizing segments into 120-foot rolling sections, we eliminated the mathematical bias that penalized long pipes.
Fig. 3. Asset Length Distribution Before and After Standardization
Missing Value Encoding ("White Spots"): Asset registries often lack data on "soil type" or "insulation material" in 30–50% of cases. Instead of filling these with mathematical averages, we map empty cells to a distinct categorical variable—Unknown. Historically, the lack of maintenance records strongly correlates with abandoned or neglected network sections, turning a "blank" into a critical predictor of wear.
Case Study in Practice: In our 2024 dataset, a staggering 42% of the asset registry was missing crucial "Soil Type" data. By encoding this as an independent Unknown category rather than using mean-imputation, the CatBoost model identified that pipes lacking soil data were 1.8x more likely to fail—likely because these sections hadn't been surveyed in decades.
Fig. 4. Soil Type Data Completeness
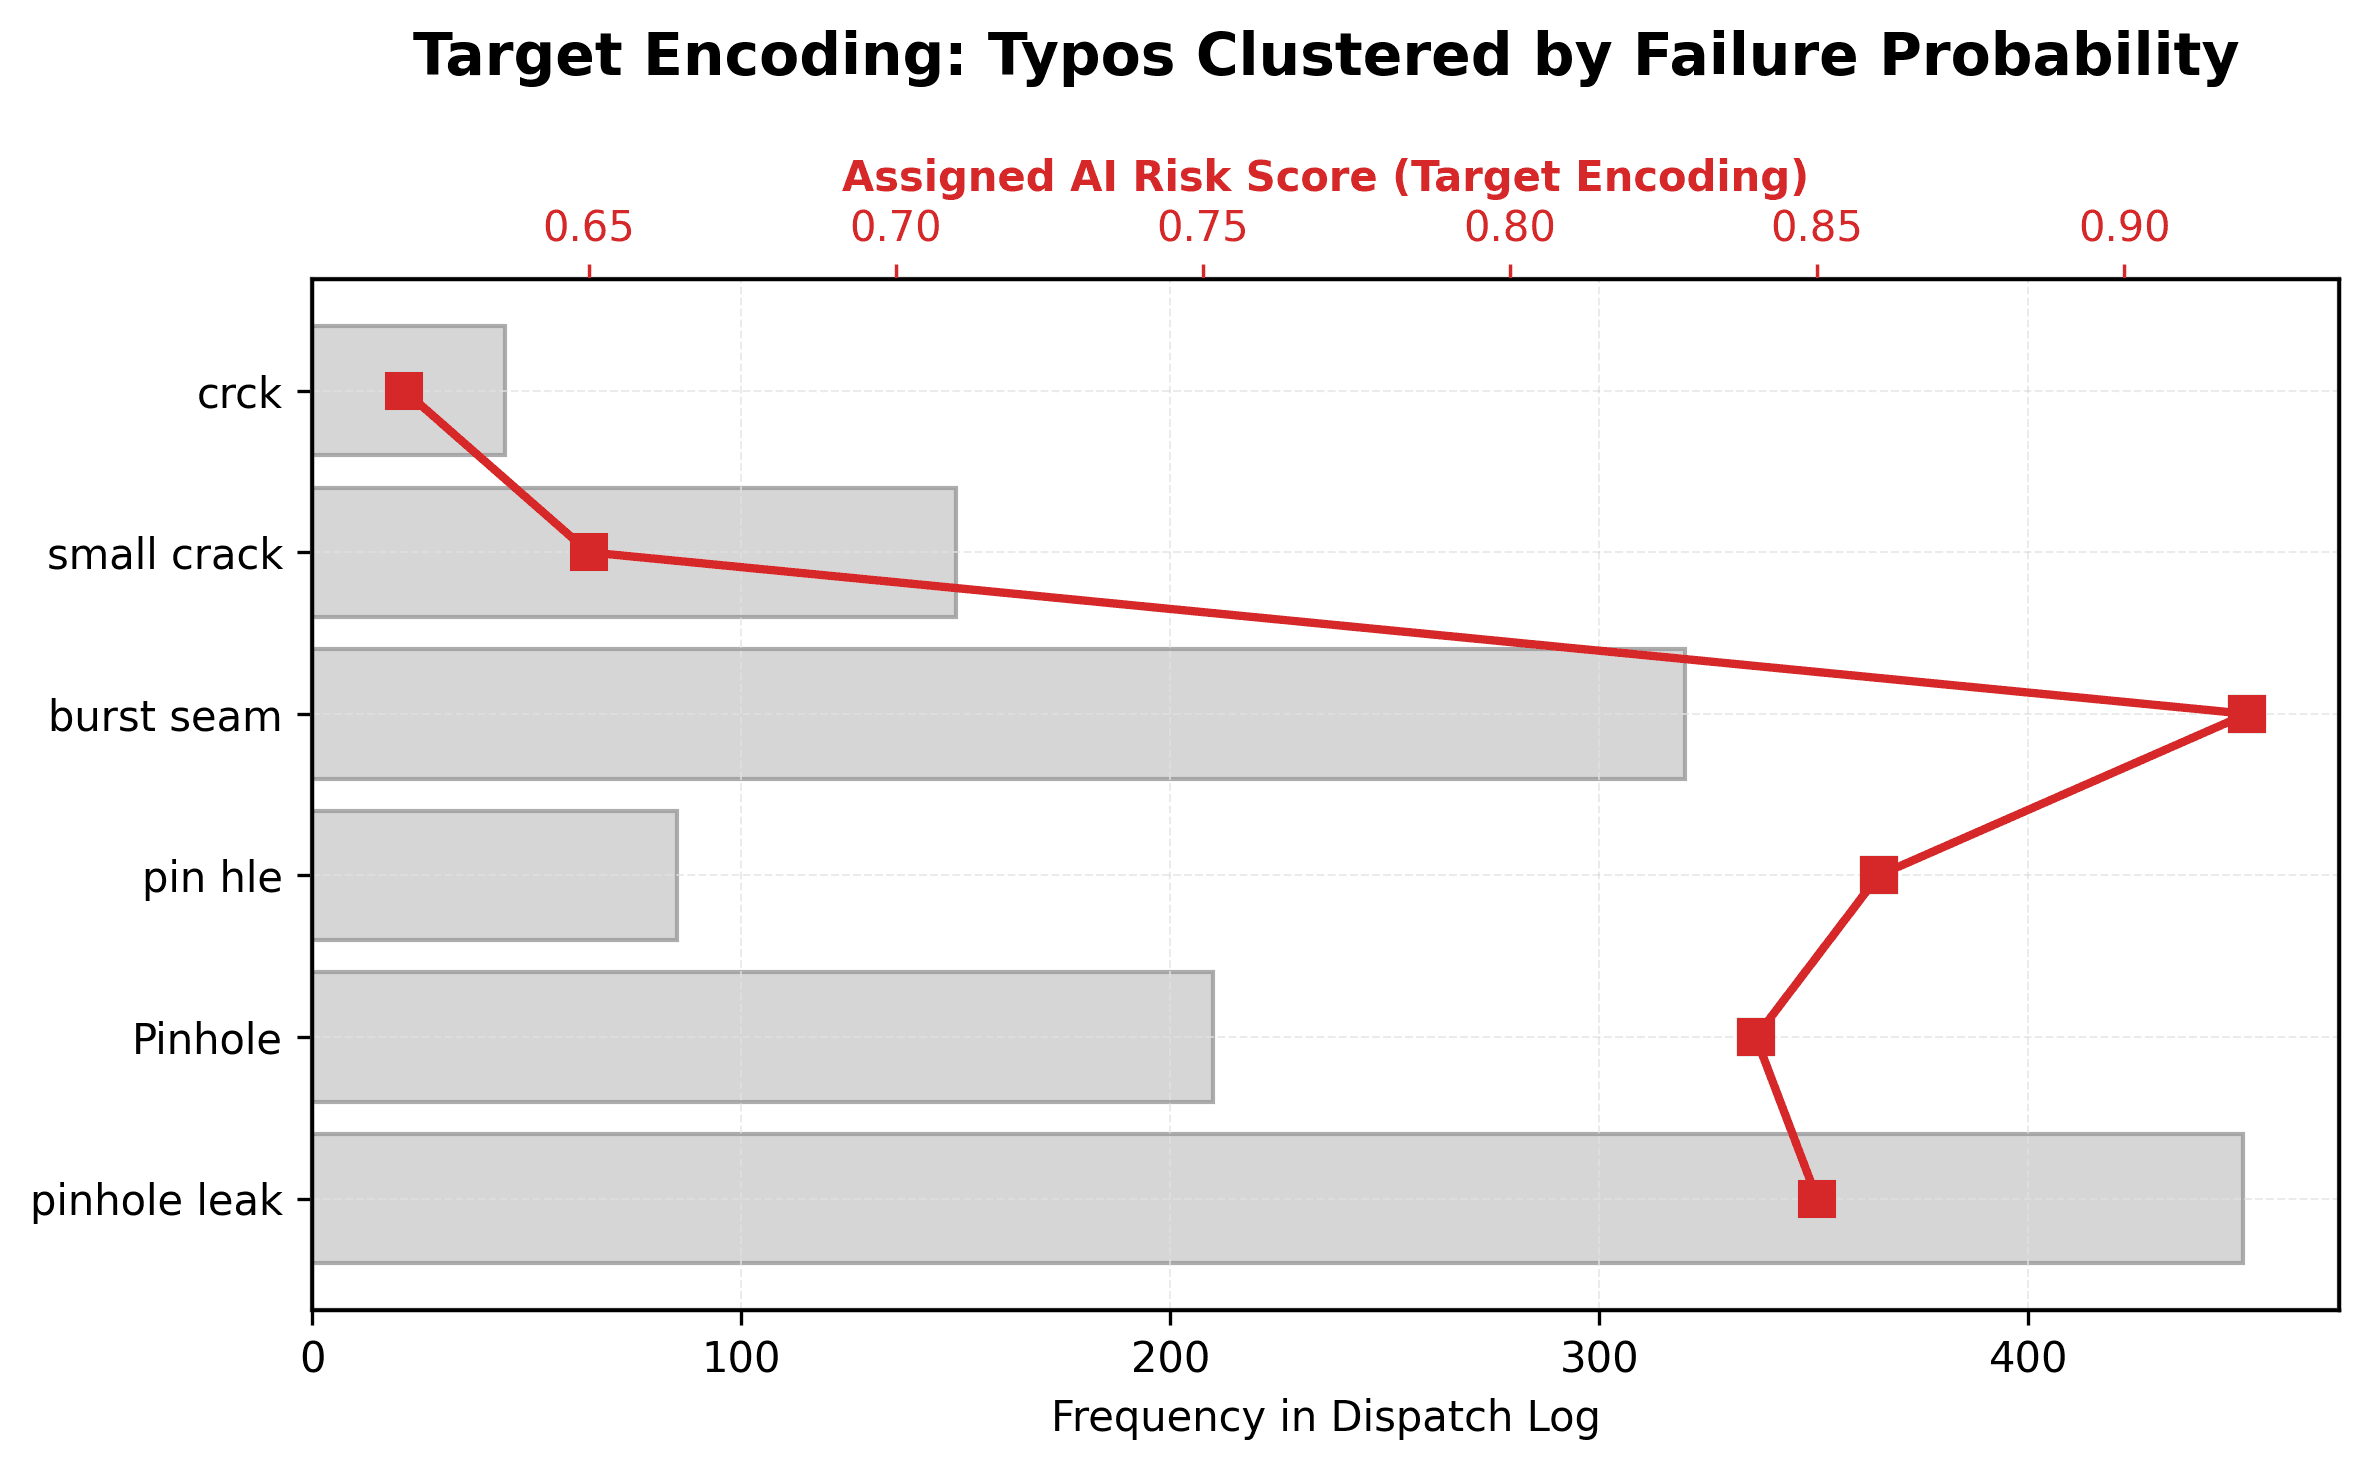
Textual Chaos Resolution (Target Encoding): Maintenance logs contain a zoo of unstructured text—from typos ("pin hle") to completely distinct failure modes ("burst seam" vs "pinhole leak"). We apply Target Encoding, assigning each unique text string the historical failure probability associated with it. This automatically groups both misspellings and distinct-but-similarly-critical defects into the same high-risk clusters, without requiring manual taxonomy mapping.
Case Study in Practice: Instead of manually categorizing 45 distinct text variations, Target Encoding assigned an AI risk score based on real failure history. Distinct defects like "burst seam" (weld failure) and "pinhole leak" (corrosion), along with their typos, received nearly identical high-risk scores (>0.84). The model learned to treat them as equally severe threats based purely on their probabilistic outcomes.
Fig. 5. Target Encoding of Typos and Distinct Defect Types
Dynamic Calculation of Actual Wear: If a pipe was installed in 1990 but had a 100-foot section replaced in 2012, its age is distorted. We introduced a synthetic parameter, Service Life in Days, which dynamically resets or adjusts upon detecting a major overhaul record.
Case Study in Practice: We analyzed a main line installed in 1990. On paper, by 2026, it was 36 years old and flagged as "critical risk". However, records showed a major 100-foot segment replacement in 2012. Our dynamic Service Life in Days feature reset the local age counter, dropping the actual wear to ~14 years by 2026. This instantly removed the false positive alert and saved projected CAPEX.
Fig. 6. Asset Age Adjustment Over Time
3. Results & Performance
By embracing the chaos rather than trying to sanitize it, the data engineering pipeline served as the critical foundation that allowed our downstream boosting-blending ensemble to achieve highly accurate results:
Metric
Before Data Cleaning (Raw Features)
After Data Cleaning (Engineered Pipeline)
Precision
58.2%
84.1%
Recall
62.4%
93.88%
False Positive Rate
High (Length biased)
Minimized
Precision: False Positives on long transmission mains and historically old (but recently modernized) pipes dropped significantly due to length normalization and dynamic age calculations.
Recall: Spatial aggregation and Tag mapping allowed the Stage 3 optimization algorithm to hit a Recall of 93.88% on the balanced evaluation subset, as the model was no longer penalized for dispatcher coordinate errors.
Coverage & Processing Speed: Field engineers were relieved of hundreds of hours previously spent scrubbing legacy drop-down menus, allowing for rapid model deployment directly on raw database dumps.
4. Conclusion & Business Impact
The main takeaway for utility directors, CIOs, and chief engineers is this: the mess in your data is normal. It is the natural consequence of operating complex physical systems over many decades.
Modern AI architectures are inherently designed as noise filtration systems. Dispatcher errors, inaccurate addresses, and empty fields in documentation do not block the neural network. By identifying these anomalies, the AI learns to compensate for the human factor, ensuring predictive accuracy even on the "dirtiest" datasets. Handing over data for analysis is not an exam on record-keeping hygiene; it is a vital step toward proactive CAPEX planning and fixing networks before they fail.
Limitations
While this pipeline is highly robust against random noise and missing categorical variables, it still struggles with systemic falsification (e.g., if repair dates are intentionally altered to meet regulatory quotas across the entire dataset). Furthermore, spatial aggregation reduces the granularity of predictions from a specific 1-foot pipe segment to a 250-foot zone, which requires crews to perform local acoustic or visual inspections within the flagged zone.
Citation
This case study is permanently archived as a preprint on Zenodo:
Ivanaiskii, A., Ivanaiskii, E., & Shipilov, S. (2026). Overcoming Data Chaos: How Machine Learning Compensates for Inaccurate Utility Records [Preprint]. Zenodo. https://doi.org/10.5281/zenodo.20673257