Application of Hybrid ML Models for Pipeline Failure Prediction
Evgeny Ivanaiskii, PhD
Domain Expert
Ivan Nazarov
Materials Science Expert
Pavel Chistyakov
Artificial Intelligence Researcher
Aleksandr Ivanaiskii, PhD
Industrial AI Founder & Systems Architect
Abstract
Urban district heating and water supply systems are exposed to increasing operational risks caused by ageing pipeline infrastructure, heterogeneous operating conditions, and the accumulation of local defects. This study proposes a data-driven approach for forecasting failure risk in aggregated pipeline sections on the basis of engineering characteristics and multi-year failure history.
The dataset was restructured at two levels: individual pipeline assets identified by Sys and aggregated risk-oriented sections. Annual failure counts for 2019–2025 were used to construct temporal features, while static engineering parameters and installation characteristics were used as additional explanatory variables.
A two-level hybrid artificial intelligence model was developed. At the first level, ensemble machine learning models (Gradient Boosting, Random Forests) estimate the failure risk of individual Sys assets. At the second level, Sys-level scores are aggregated into section-level risk indicators. The best risk-detection mode achieved an ROC-AUC of 0.8539 and successfully identified 460 out of 490 pre-failure sections a full year in advance.
1. Introduction
The reliability of municipal district heating and water supply systems is a critical factor in the sustainable functioning of modern cities. A significant proportion of European pipeline infrastructure was constructed decades ago and is subject to cumulative effects of corrosion, external mechanical loads, aggressive soil conditions, and cyclic variations in hydraulic regimes. As networks age, the frequency of failure events increases, maintenance costs rise, and the need for modernisation of asset management methods intensifies [1].
Traditional planning approaches include regulatory service life limits, periodic inspections, and analysis of statistical failure data. However, they rarely take into account local operating conditions and are unable to reflect the complex dynamics of degradation at the level of individual network sections.
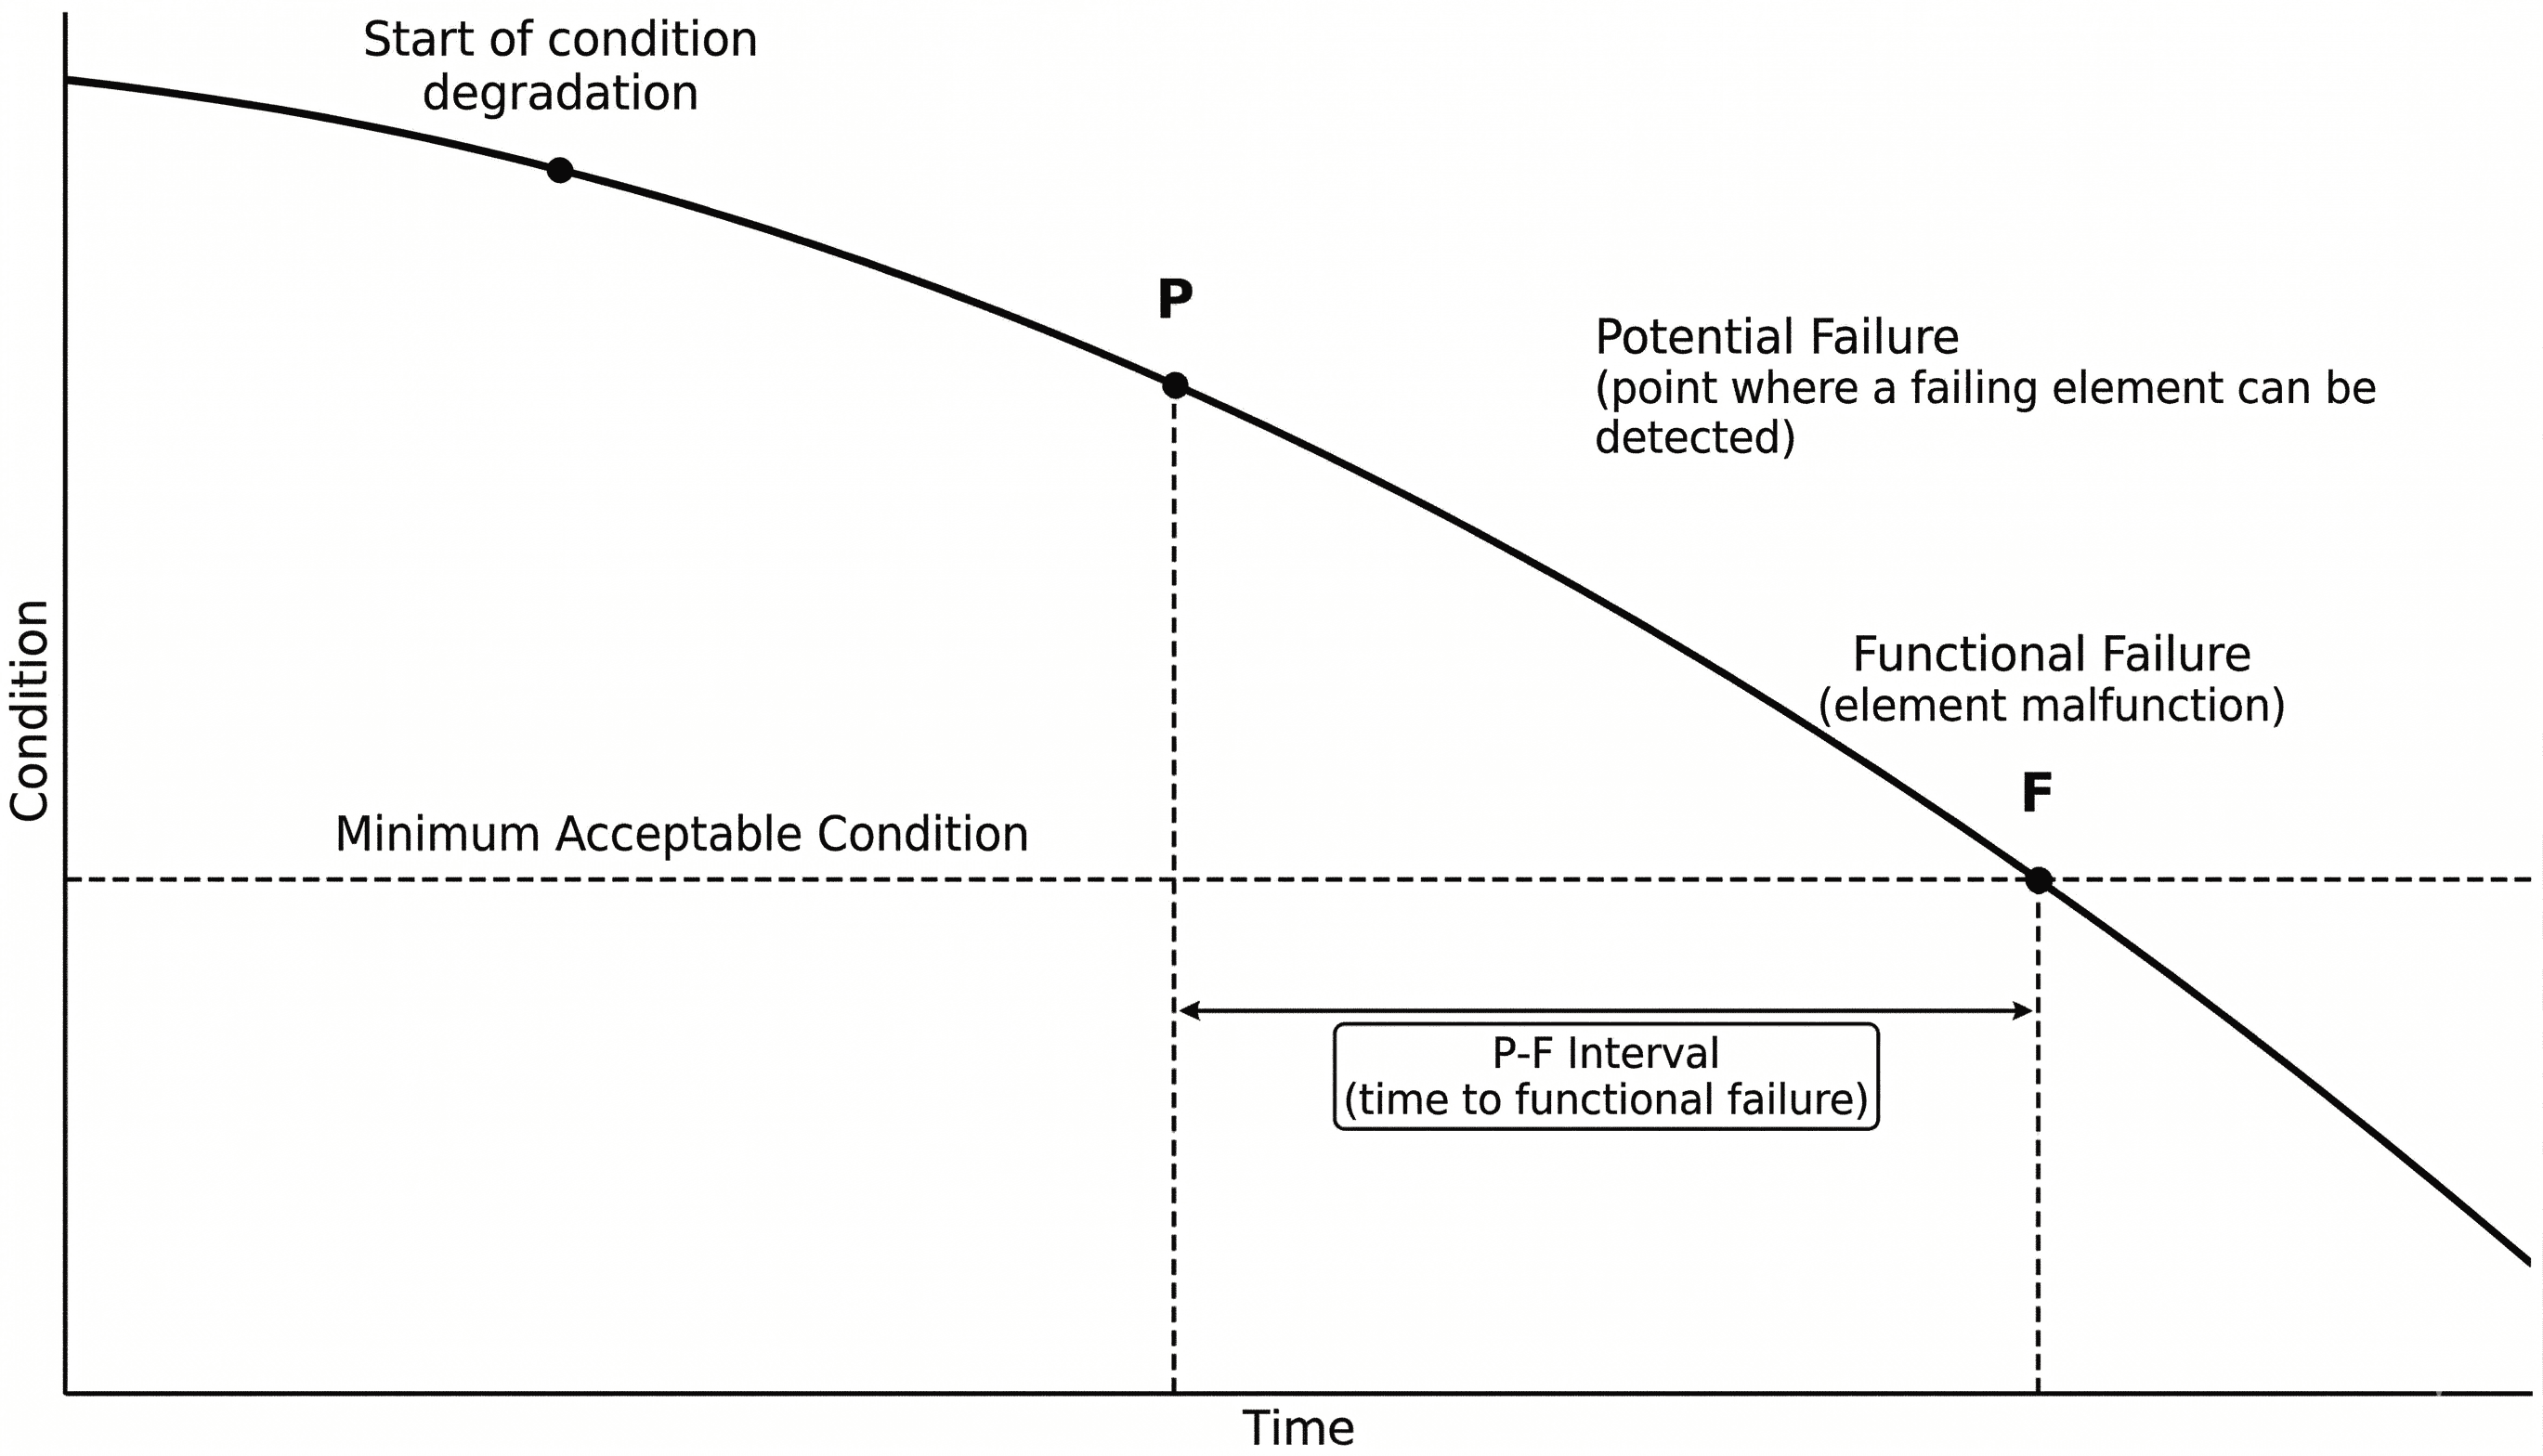
Analyzing the Potential to Functional (P-F) failure prevention curve tracks the development of a defect from its detection to functional failure. For instance, if thickness measurements reveal a pipe wall thinning, this serves as a sign of potential failure (Point P). The forecasted failure moment is represented by Point F.
Recent advances in artificial intelligence make it possible to model technogenic processes as a combination of static properties of an asset and temporal trends in its degradation. While deep neural networks (like LSTMs) have been explored, they often require long data sequences and struggle with the extreme class imbalance and short retrospective windows characteristic of municipal datasets.
The objective of this study is to develop and investigate a hybrid machine learning pipeline based on robust ensemble algorithms (Gradient Boosting and Random Forests) capable of accounting for both static and temporal data, providing accurate probabilistic forecasting of failure events.
Novelty and Contribution
Unlike classical statistical approaches (such as Weibull distributions or simple regression), which provide averaged risk assessments for a population of pipes, our model captures the complex, localized degradation dynamics of individual network segments. Furthermore, unlike deep sequential models (e.g., LSTMs) that require massive, perfectly balanced datasets and long historical windows, the proposed two-level architecture uses Gradient Boosting to naturally handle extreme class imbalance, missing data, and short retrospective timeframes (3–5 years). This makes it highly pragmatic and immediately deployable for real-world municipal infrastructure constraints.
2. Dataset Formation
The updated dataset was formed using a consolidated heating network database from ZuluGis. The file contains 8,251 valid records representing 8,243 unique Sys identifiers and 1,920 aggregated Sections.
A challenge arose due to uneven segment lengths, as individual Sys lengths varied from 0.1 m to 200 m. To normalize and aggregate the data, manual grouping was performed based on the "Section" and "Tag" criteria. Each Sys corresponds to an individual pipeline asset, whereas a Section represents a technologically or territorially aggregated group of adjacent assets used for operational decision-making.
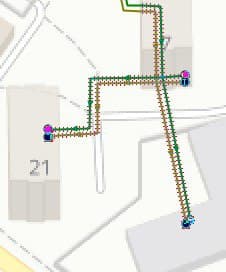
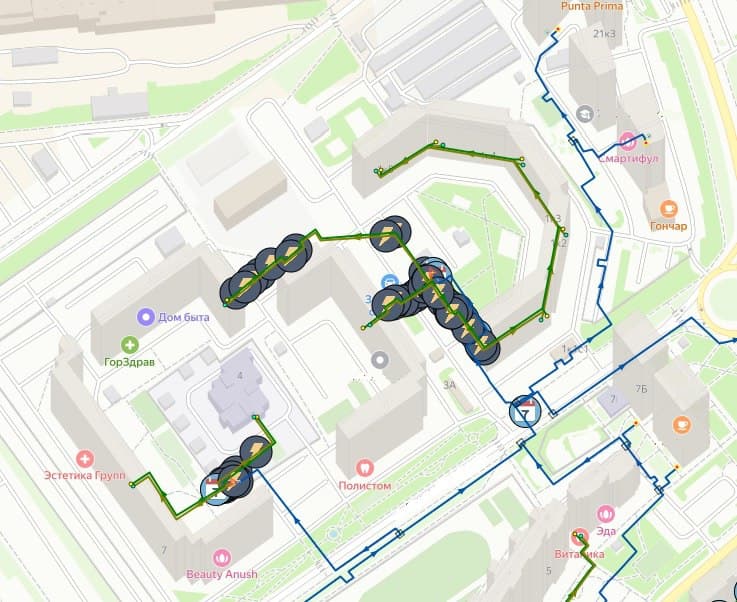
For each Sys and section, annual failure statistics were extracted for the years 2019–2025. The target variable was defined as a binary indicator: a value of 1 was assigned if at least one failure was recorded in the target year for the considered section, and 0 otherwise.
3. Hybrid Two-Level Risk-Scoring Architecture
The final architecture was implemented as a two-level hybrid machine learning pipeline.
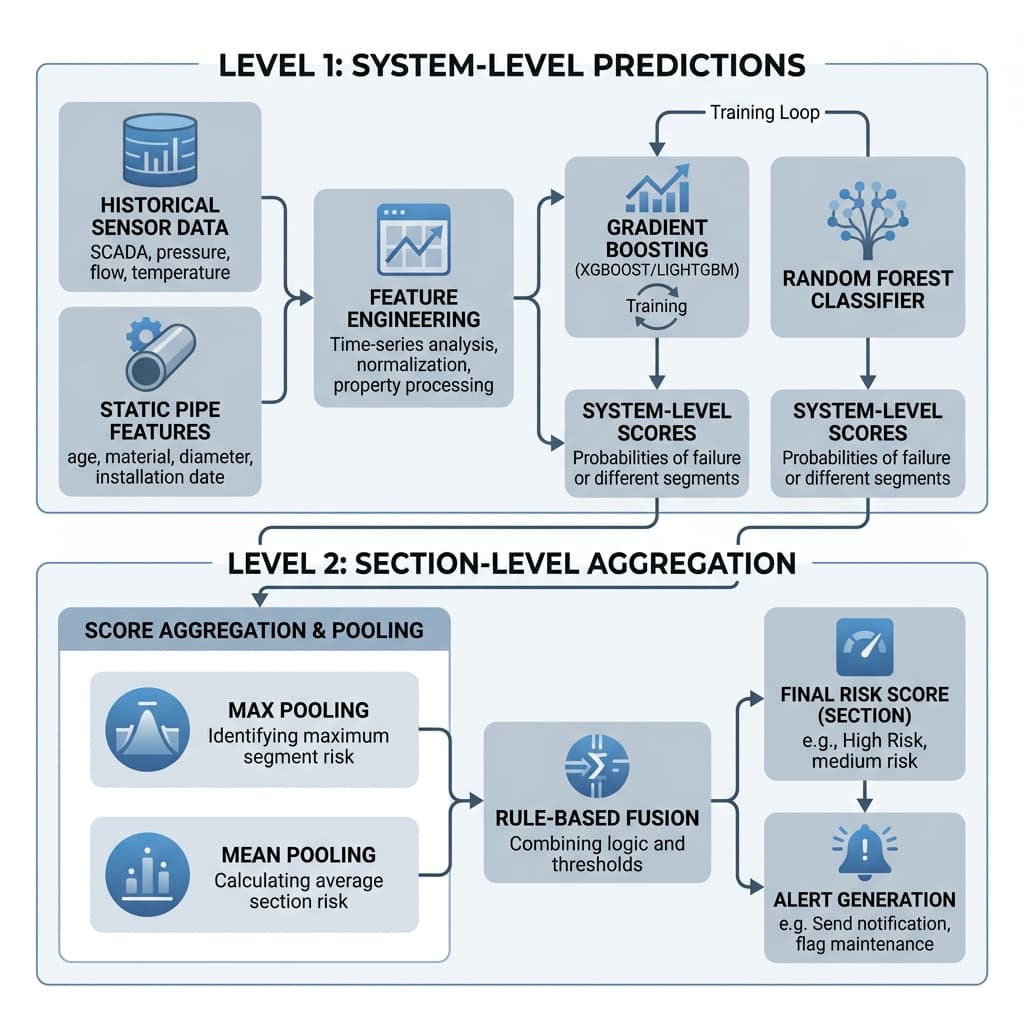
- First Level (Sys-level): Assesses the failure risk of individual pipeline elements. The input feature space consists of historical failure variables (annual count, cumulative history) and static engineering parameters (pipe geometry, service life, laying type, insulation). Algorithms evaluated included Gradient Boosting, Histogram-based Gradient Boosting, and ExtraTrees.
- Second Level (Section-level): Element-level scores are aggregated to the section level using mathematical functions (max, mean, top-k). This structure reflects the physical nature of the network: a section becomes critical if at least one of its constituent elements demonstrates a high failure risk.
4. Results
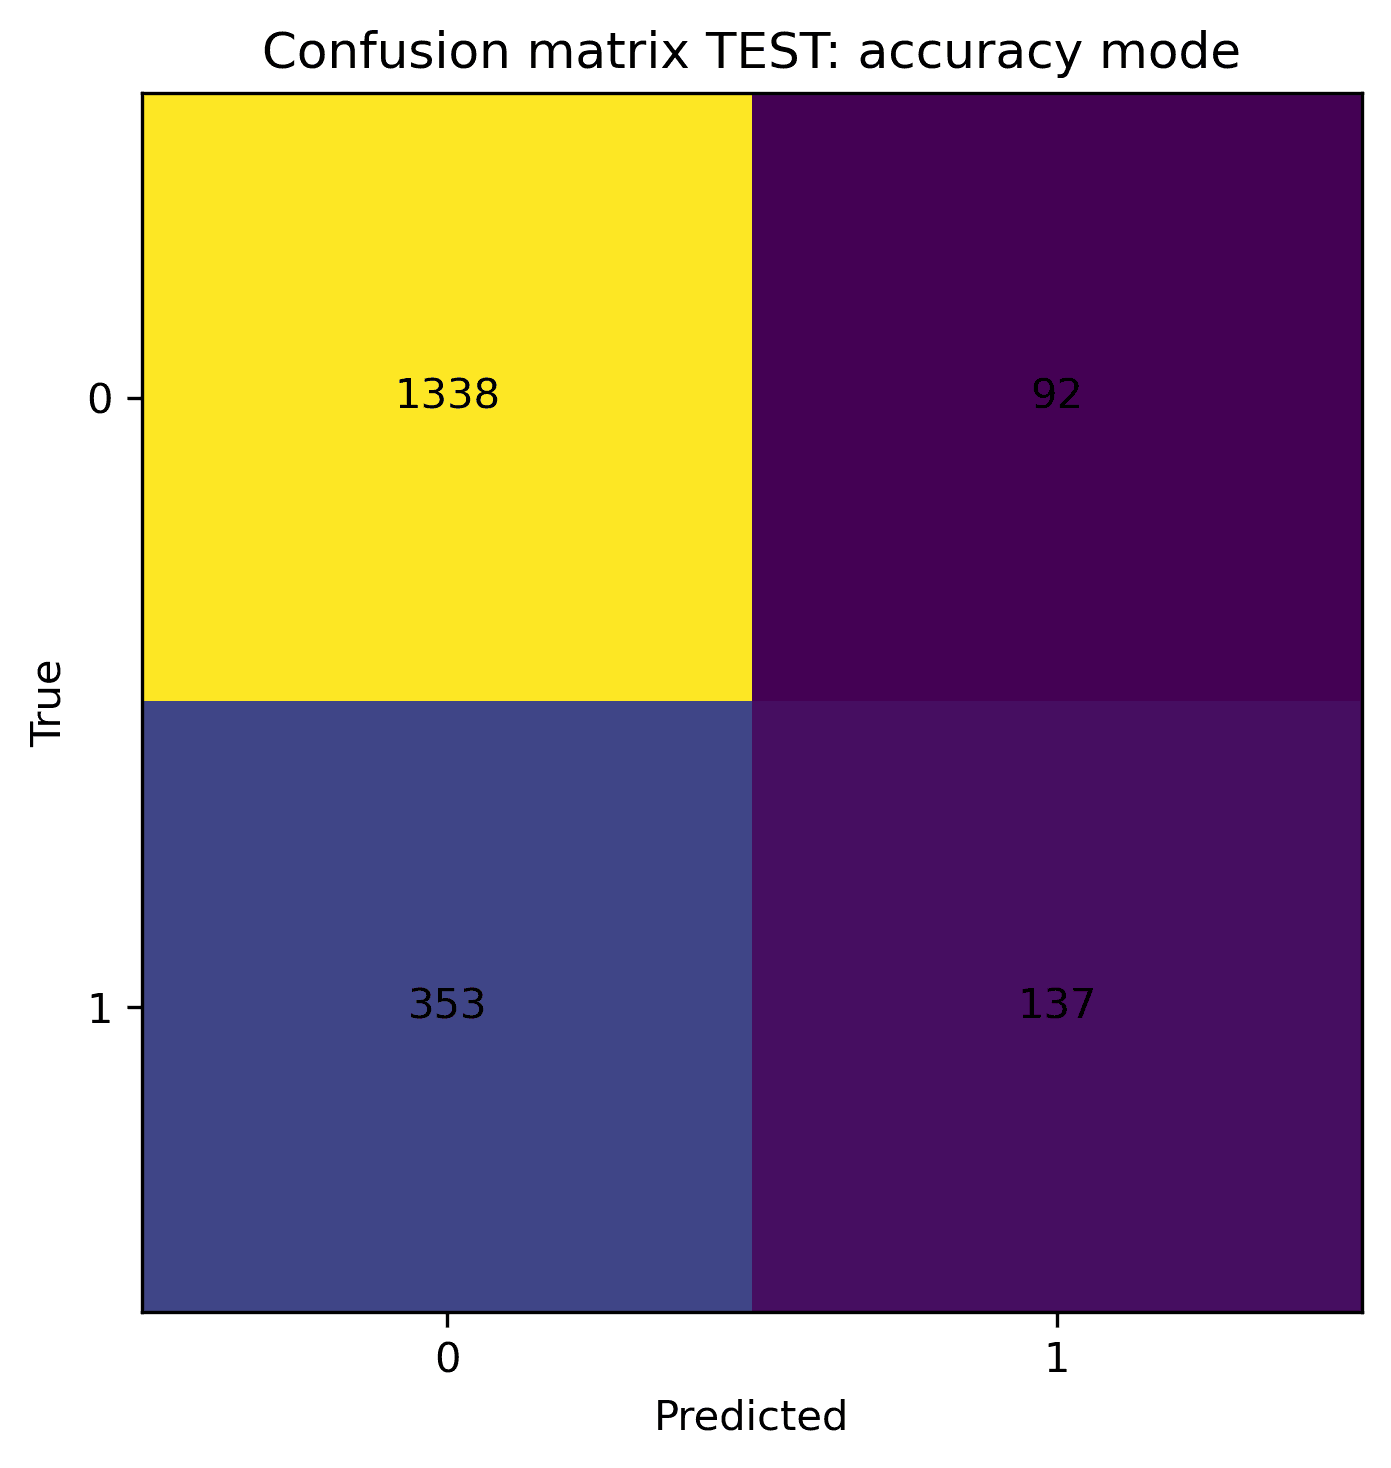
The main test year was 2023, containing 1,920 sections, of which 490 had at least one recorded failure (25.52%).
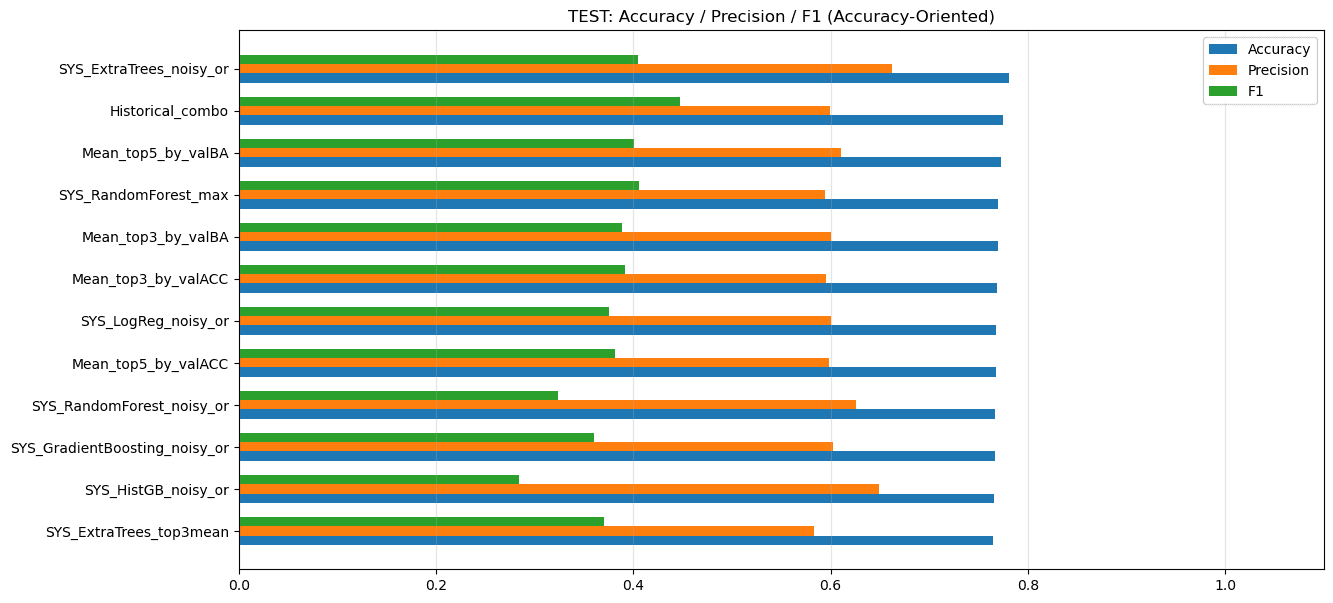
The best Risk-detection mode was obtained using a Sys-level Gradient Boosting model with max aggregation to sections. On the test year, this mode achieved:
- Accuracy = 0.7651
- ROC-AUC = 0.8539
- F1-score = 0.6710
- Recall = 0.9388
- Balanced Accuracy = 0.8222
The model correctly detected 460 of 490 failure-prone sections, while only 30 failure-prone sections were missed.
Risk Ranking Quality
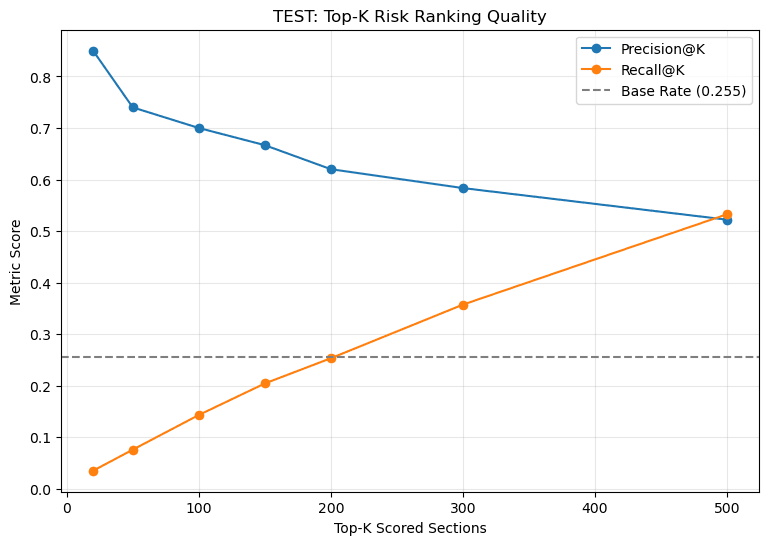
Since operational services often use the model as a prioritization tool, the Risk-ranking quality was evaluated. In the TOP-20 sections with the highest calculated risk, 17 were indeed pre-failure sections. In the TOP-100 sections, 81 were pre-failure (Precision@100 = 0.81).
Selective High-Confidence Mode
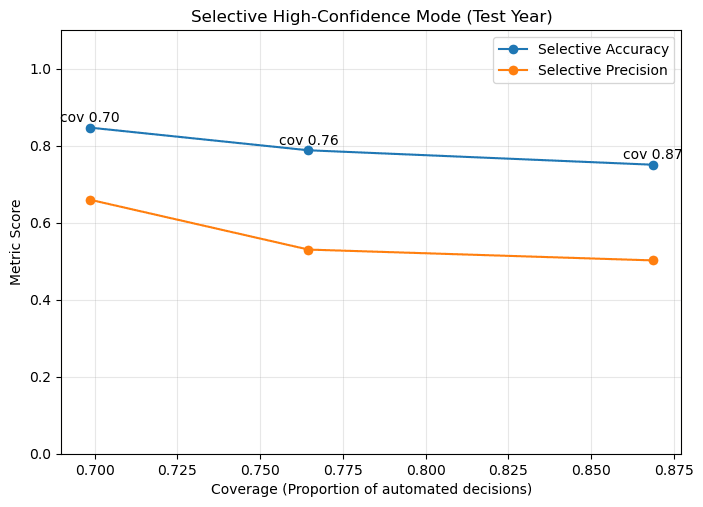
A selective high-confidence mode was also analysed. In this mode, the model makes an automatic decision only for sections with a sufficiently confident low-risk or high-risk score, while borderline sections are left for expert review. At a coverage of 0.6922 (the proportion of pipes processed automatically), the selective accuracy reached 0.8412.
5. Conclusion
A methodology for predicting the annual failure risk of urban district heating and water supply pipeline sections has been developed. The model combines historical failure dynamics with static engineering characteristics and evaluates risk at both the Sys level and the aggregated section level.
The developed two-level hybrid model demonstrated strong predictive capability on the test year 2023. In the risk-detection operating mode, it achieved a Balanced Accuracy of 0.8222 and an ROC-AUC of 0.8539, successfully detecting 460 out of 490 failure-prone sections.
The proposed framework can be used as a decision-support tool for risk-oriented maintenance planning. Implementing such systems within a SaaS paradigm allows municipal services to reallocate maintenance budgets based on data-driven metrics, minimizing the frequency of critical ruptures and unplanned downtime.
Limitations
The current model was evaluated on historical data from a limited number of municipal heating systems with a specific climatic and engineering context. The extreme class imbalance inherently limits the precision of fully automated "black-box" decision-making, which is why the selective high-confidence mode is recommended for production use. Further development will involve cross-regional validation, integration of IoT sensor telemetry, and dynamic calibration of risk thresholds for different operational maintenance policies.
Open Source Demo Want to see how the core logic works? We have published a simplified demonstration of the two-level aggregation using a synthetic dataset on GitHub: Rivixi AI Pipeline Failure Demo
Acknowledgments
The authors used AI-assisted tools for language editing and translation. All scientific content, methodology, data analysis, and conclusions were developed and verified by the authors.
References
- Giraldo-González M.M., Rodríguez J.P., et al. Learning Models for Pipe Failure Modeling in Water Distribution Networks. Water, MDPI, 2020;12(4):1153.
- Latifi M., Zali R.B., Javadi A.A., Farmani R., et al. Customised-sampling approach for pipe failure prediction in water distribution networks. Scientific Reports. 2024;14:18224.
- Kutyłowska M., et al. Prediction of Failure Frequency of Water-Pipe Network in the Selected City. Periodica Polytechnica Civil Engineering. 2017;61(3):548–553.
- Aggarwal K., Atan O., Farahat A., et al. Two Birds with One Network: Unifying Failure Event Prediction and Time-to-Failure Modeling. arXiv preprint. 2018. arXiv:1812.07142.
- Farahat A., Cheng A., Koshy P., et al. Predictive Analytics for Water Asset Management: Machine Learning and Survival Analysis. arXiv preprint. 2020. arXiv:2007.03744.
- Moubray, J. Reliability-centered Maintenance. Industrial Press Inc. (Reference for the P-F curve methodology and asset risk management).
- Members of OPMG/STF-1. Fifty Years of European Oil Pipeline Safety and Environmental Performance Statistics, Concawe Review, Volume 31, 2022.
Citation
This research paper is permanently archived as a preprint on Zenodo:
Ivanaiskii, E., Nazarov, I., Chistyakov, P., & Ivanaiskii, A. (2026). Application of Hybrid ML Models for Pipeline Failure Prediction [Preprint]. Zenodo. https://doi.org/10.5281/zenodo.20675494